Alignments basics
File formats#
Aligned reads from sequencing can be loaded into IGV in the BAM format, SAM format, or CRAM format.
BAM and CRAM files are required to have an associated index file.
-
The main data file must include the .bam or .cram extension.
-
The index file should have the same filename but with the .bai or .crai extension. For example, the index file for test-xyz.bam would be named test-xyz.bam.bai, or alternatively test-xyz.bai.
-
When loading by URL, the URL to both the data file and the index file should be specified.
-
When loading by file, IGV automatically searches for the index file within the same directory as the data file.
If you receive a .bam file from a sequencing facility, you will usually also get the corresponding index file. If you need to create the index yourself, there are multiple tools available for indexing BAM files, including igvtools, the samtools package, and the Picard.SortSam module in GenePattern.
Experiment type#
When an alignment file is loaded, the details of the file are examined to determine the experiment type:
- RNA (RNA sequencing)
- 3rd Gen (third generation / long read sequencing, e.g. from PacBio and Oxford Nanopore Technologies)
- Other (e.g. Illumina short read DNA sequencing)
The experiment type can also be set directly for a loaded file by right-clicking on the track and selecting one of the above values from the Experiment Type section of the pop-up menu.
Some track defaults and available options in the track pop-up menu are determined by the experiment type. The View > Preferences window has three tabs of alignment preferences. The Alignments tab is for all general preferences and the RNA and Third Gen tabs are for attributes that are unique to those experiment types and general preferences that have different default values for those experiment types.
Visibility window#
A typical alignment file is too large to fit into the IGV application memory. Instead, alignments are loaded only for the region in view, as long as the region is not too large. A visibility range threshold defines the window size at which alignments are loaded and visible. If the region in view is larger than this threshold, no data is visible. The track will display a message indicating you need to zoom in to a smaller region to see the data.
The default value for the visibility range threshold depends on the Experiment Type:
- RNA: 300 kilobases
- 3rd Gen: 1000 kilobases
- Other: 30 kilobases
You can adjust the above settings in the View > Preferences window. Click on the RNA tab to set the default threshold for RNA-seq data; the Third Gen for long-read data; and Alignments for other sequencing types.
If you have low coverage data, you can provide a larger visibility range threshold. Or for deep coverage, you might want to provide a smaller visibility range threshold.
Track types#
Loading an alignment file creates up to three associated tracks:
-
Coverage Track to view depth of coverage
-
Alignment Track to view individual aligned reads
-
Splice Junction Track which provides an alternative view of RNA-seq reads spanning splice junctions (see the section on RNA-seq data)
By default, the Alignment and Coverage tracks are initially displayed for experiment type Other and 3rd Gen. For RNA-seq data, the Splice Junction Track is also displayed by default.
To hide (or show) selected tracks, right-click on the track to bring up the pop-up menu and uncheck (or check) Show Alignment Track / Show Coverage Track / Show Splice Junction Track.
To change the default setting for all tracks, select the Alignments tab (or the RNA tab for RNA-seq data tracks) of the View > Preferences window, and uncheck or check the boxes for Show alignment track / Show coverage track / Show junction track.
Coverage track#
Dynamic vs. pre-computed#
By default, IGV dynamically calculates the coverage for an alignment file and displays the number of reads (depth) at each locus as a bar chart.

When the view is larger than the visibility window, the dynamic coverage track is blank because the alignments have not been loaded and therefore the coverage cannot be computed.
Alternatively, you can provide a file containing pre-computed coverage data. When this option is used, the track displays coverage at all zoom levels including at the whole genome and chromosome view. To generate the extended coverage data file, use the igvtools count command on the alignment file to create a TDF file. The resulting file can be associated with the alignment track by one of the following:
-
Right-click on the coverage track and choose Load pre-computed coverage data... from the pop-up menu.
-
To automatically load the pre-computed coverage when the corresponding alignment file is loaded, name the coverage file
<alignment file name.extension>.tdf, and place it in the same directory as the alignment file. For example, the coverage file for test.bam would be named test.bam.tdf.
Data range#
A coverage track's data range specifies the Y-axis for the coverage bar chart. The data range for the coverage track can be set in the same way as for quantitative data tracks.
Color scheme#
If all the reads at a locus match the reference genome, the coverage bar is grey (or whatever the current setting is for the coverage track color). However, color is used to highlight mismatches to the reference. If a nucleotide differs from the reference sequence in greater than 20% of quality weighted reads, the bars are colored in proportion to the read count of each base.

To override the default threshold of 20%, do one of the following:
-
To override the threshold for an individual coverage track, right-click on the track and select Set allele frequency threshold.... For example, set the value to 0.3 to change the threshold to 30%.
-
To change the default for all coverage tracks, set the value Coverage allele-fraction threshold in the Alignments tab of the View > Preferences window.
To disable quality weighting, uncheck the Quality weight allele fraction checkbox in the Alignments tab of the View > Preferences window.
To change the base color of the bar chart, right-click on the coverage track and select Change Track Color... from the pop-up menu.
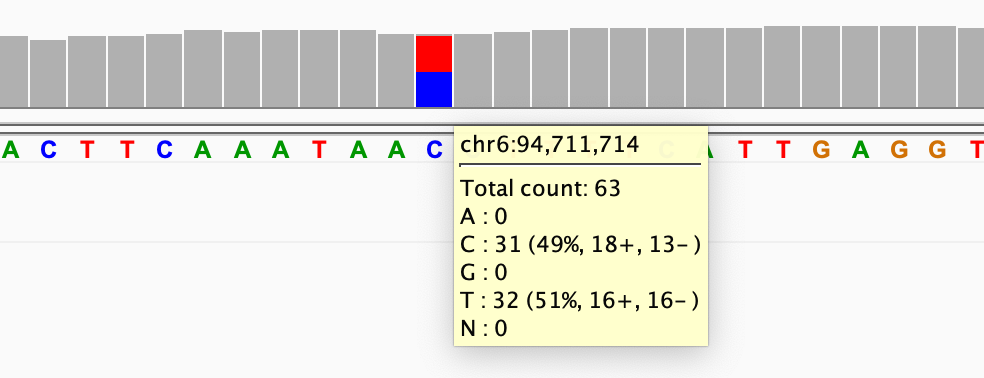
To view the read count details at a locus, click on a coverage bar (or hover over the bar if you have set the info popup text to display on hover rather than click). To copy the count details to your computer's clipboard, right-click on the bar and select Copy Details to Clipboard.
In the following example, you can see the details include the locus, the counts for each nucleotide, and the split between reads on the negative and positive strand.
Alignment track#
Alignments#
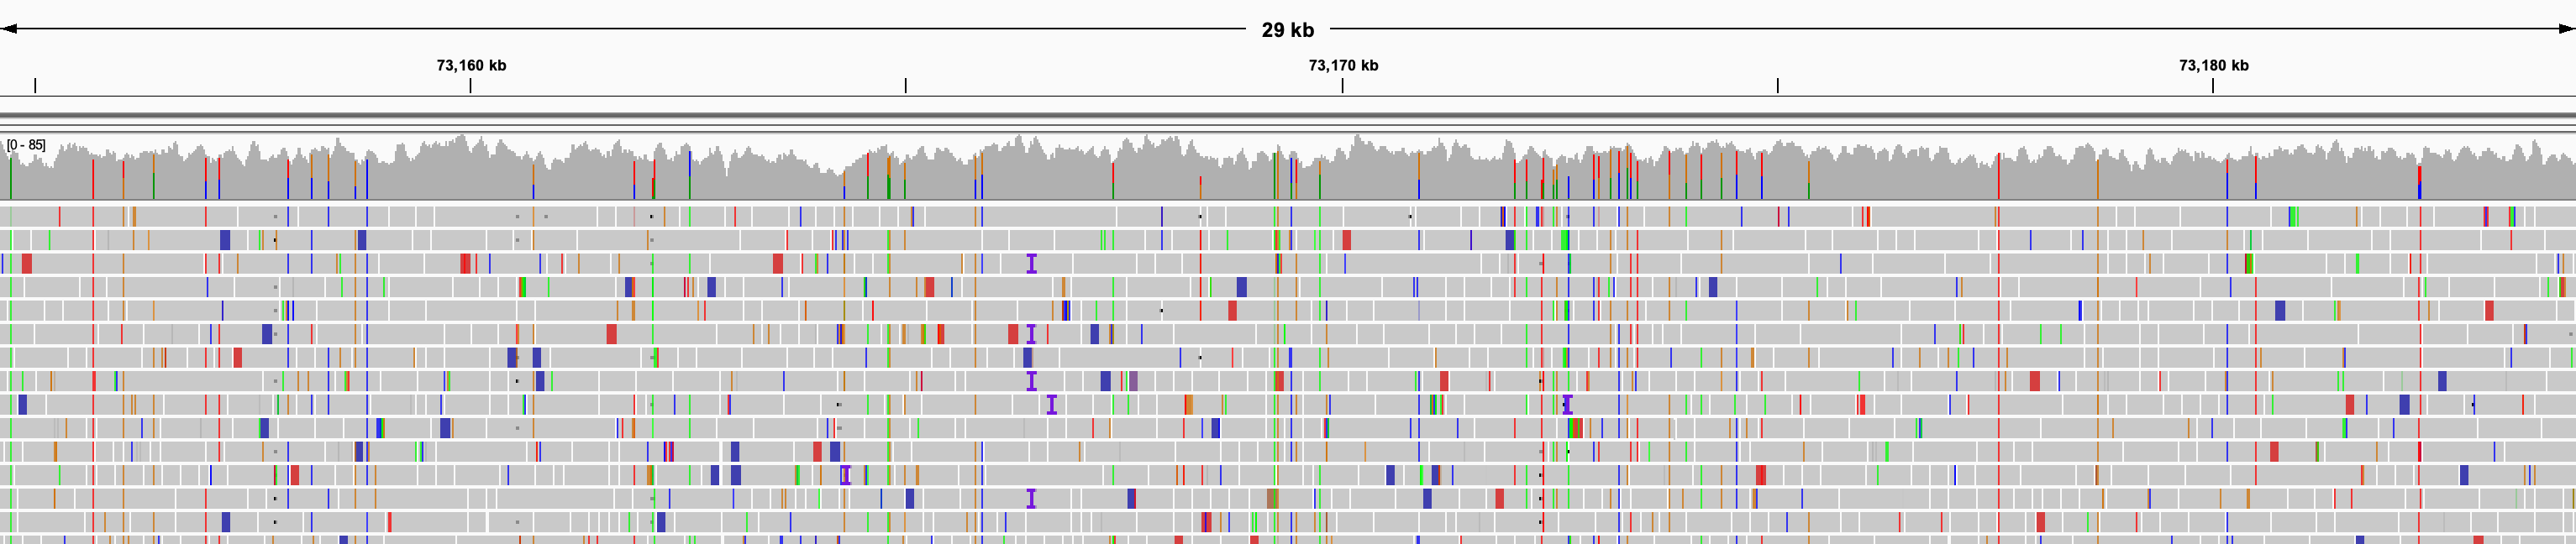
The alignments are loaded and displayed when the region in view is smaller than the visibility window threshold. When the region in view is too large, the alignment track will be blank except for a message informing you to zoom in to a smaller region to see the alignments.
At the default threshold, the view can provide a good overview of the alignments but individual aligned reads are not easily discernable.
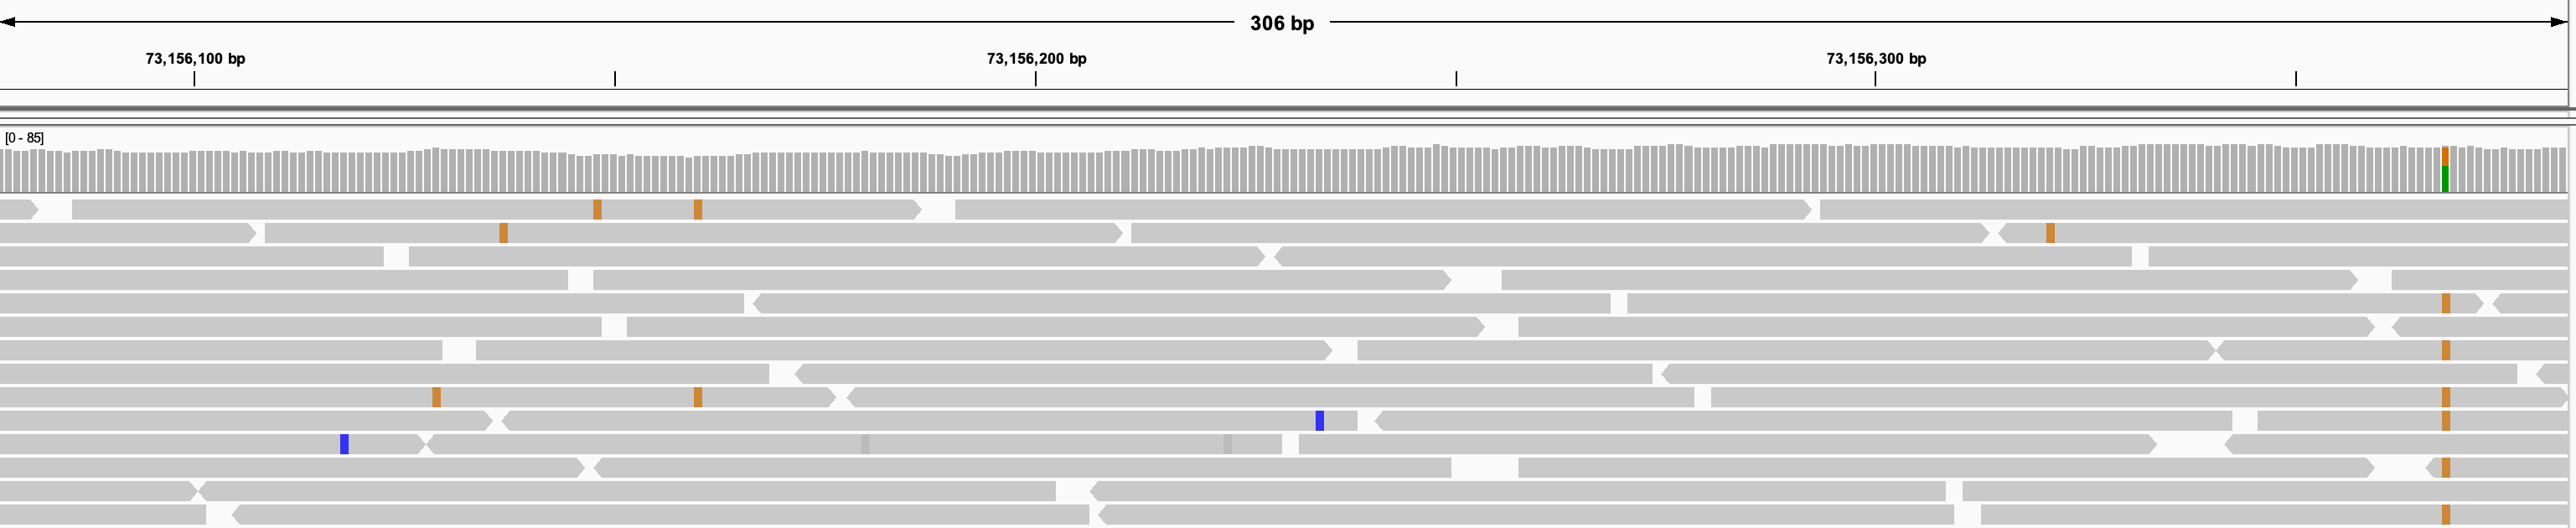
When zoomed further in, the alignments appear as horizontal bars with a point on one end to indicate the direction of the read.
Alignment files include detailed information about each aligned read. To retrieve these details for an alignment:
-
Click on an alignment to see the details in a pop-up window.
You can change the behavior of the detail pop-up window by clicking on the yellow balloon icon in the IGV toolbar.

For example, to quickly see the details for many alignments in succession, change the behavior from Show Details on Click (the default) to Show Details on Hover. -
To copy the details to the computer's clipboard, right-click on the alignment and select Copy read details to clipboard from the pop-up menu.
-
To copy the read sequence to the computer's clipboard, right-click on the alignment and select Copy read sequence from the pop-up menu.
The IGV display of the aligned reads uses color, transparency, and symbols to highlight some of the information details, as described in the sections below. You can also sort and group the alignments based on various attributes, which may help highlight patterns and anomalies in the data.
Base mismatches#
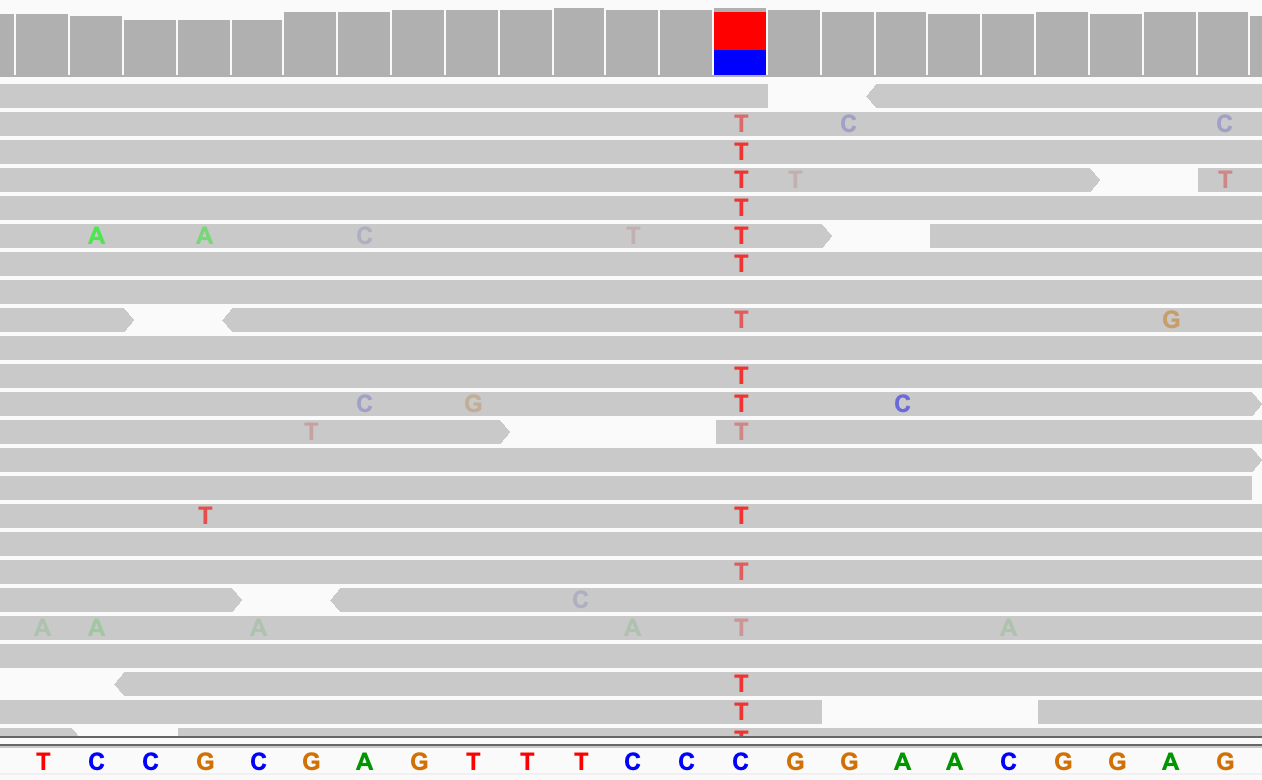
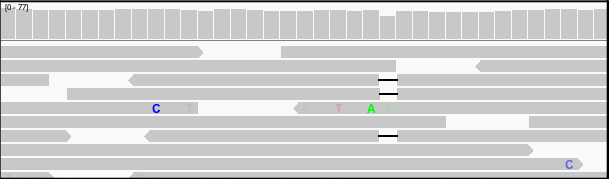
By default, read bases that match the reference sequence are displayed in gray (or whatever the current setting is for the alignment track color). Read bases that do not match the reference are displayed in color. By default, adenine ( A) is green, cytosine (C) is blue, guanine (G) is yellow, and thymine (T) is red.
In addition, mismatched bases are assigned a transparency value that is inversely proportional to the base call's phred quality score. This has the effect of de-emphasizing low quality mismatches to make the high quality mismatches stand out.
All the values for the display of base mismatches are user-settable:
-
To color code all bases in a track, regardless of whether they are mismatched, right-click the track and select Show all bases from the pop-up menu. To change it in all tracks, check the box with the same name in View > Preferences > Alignments.
-
To color code none of the bases in a track, regardless of whether they are mismatched, right-click the track and click on Show mismatched bases in the pop-up menu. To change it in all tracks, uncheck the box with the same name in View > Preferences > Alignments.
-
To disable the transparency shading of quality in a track, click on Shade base by quality in the track's pop-up menu. To disable it for all tracks, uncheck the box named Shade mismatched bases by quality in View > Preferences > Alignments.
The preferences window also allows you to control the transparency range via the parameters Maximum transparency at base quality (default is base quality = 5) and No transparency above base quality (default is base quality = 20).
- To change the background color of the alignments from the default grey color, right-click in the alignment track and select Change Track Color... from the pop-up menu.
Indels#
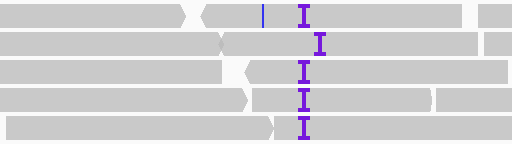
Deletions with respect to the reference genome are displayed with a black bar. The length of the bar indicates the size of the deletion. The following screenshot has three examples of single-base deletions.
Insertions with respect to the reference genome are indicated with a purple I. Click on the insertion symbol (or
hover over it if you have changed the pop-up text behavior) to view the inserted bases.
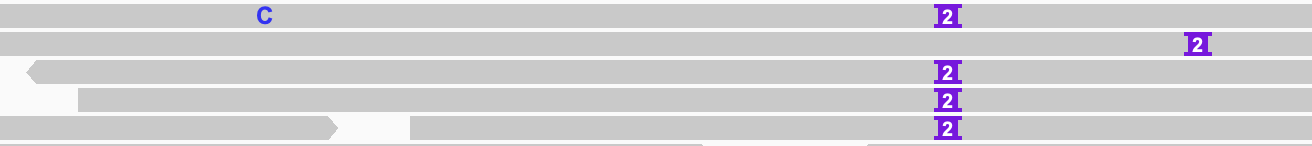
When sufficiently zoomed in, indels (deletions and insertions) larger than one base are by default labeled with their size. The following example shows a zoomed in view of the above insertions and we can see they are each 2-bases.
To disable labeling the indel size, uncheck the box Label indels > threshold in the Alignments tab of the View > Preferences window.
Alternatively, you can change the size threshold above which indels are labeled by setting the number in the Label
threshold (bases) field. For example, in the above example, setting the value for Label threshold (bases) to 2 (or
any number larger than 2) would have the effect of displaying the insertions in the lower screenshot as the purple I
without the number even when zoomed in.
To suppress the display of small indels (insertions and deletions):
-
To hide the indels in a track, right-click on the track and select Hide small indels, and then select Small indel threshold... to specify the size threshold for "small".
-
To hide the indels in all tracks, check the box Hide indels > threshold and set the Indel size threshold (bases) value in the Alignments of View > Preferences.
Any indels smaller than the threshold number are not displayed. For example to hide all the two-base insertions in the above example, the threshold must be set to 3 or more.
Controlling indel preferences is different in third gen alignment tracks.
-
One-base indels are hidden by default (vs. shown by default for other experiment types). To show all indels or to change the size threshold for hidden indels in third gen alignments, the values must be set in the Third Gen tab of View > Preferences (not the Alignments tab).
-
Indels larger than one base are labeled by default, which is the same as for other experiment types, but changing the values must be done in the Third Gen tab of View > Preferences (not the Alignments tab).
Read mapping quality#
Alignments that are displayed with a transparent or white fill so they appear hollow, as shown in the screenshot below, have a mapping quality equal to zero. Interpretation of this mapping quality depends on the mapping aligner as some commonly used aligners use this convention to mark a read with multiple alignments. In such a case, the read also maps to another location with equally good placement. It is also possible the read could not be uniquely placed but the other placements do not necessarily give equally good quality hits.
Alignments with a mapping quality greater than zero, can be shaded based on their mapping quality. In the track's pop-up menu click on Shade alignments by and then select mapping quality high (or mapping quality low) in the sub-menu to deemphasize alignments with low (or high) mapping quality by rendering them with increased transparency. To reset back to the default, select Shade alignments by > none.
Coloring alignments#
Alignments can be assigned colors based on alignment attributes by clicking on Color alignments by in the track's right-click pop-up menu and selecting one of the options in the sub-menu. Options include attributes such as read strand, read group, and tag value. Not all options are applicable to all alignment tracks. For example, some options are specific to paired-end alignments.
The following example shows alignments colored by read strand. As can be seen in the details displayed when you click on a read (or hover over it if the pop-up text behavior has been changed), the positive strand is indicated by the pink color, and the negative strand by the purple color.
If the alignment color is set to none, all alignments are assigned the track color. Similarly, if the selected Color
alignments by option is not applicable for a particular alignment, it is assigned the track color. The default
alignment track color is grey. To change it, select Change Track Color... from the track's pop-up menu.
If the coverage track has not been assigned a specific track color, changing the alignment track color will also change the coverage track color to a darker shade of the new alignment track color.
Grouping and sorting alignments#
The horizontal placement of reads in the IGV view is determined by their aligned locus. By default, the vertical order in which the alignments are drawn has no significance; the alignments are packed into rows to minimize the screen space required to display them all. In order to see patterns and anomalies in the data, it may be helpful to group or sort the alignments by read attributes.
Grouping#
To group the alignments in a track, click on Group alignments by in the track's pop-up menu and select one of the options in the sub-menu. Options include attributes such as read strand, read group, tag value. Not all options are applicable to all alignment tracks. For example, some options are specific to paired-end alignments.
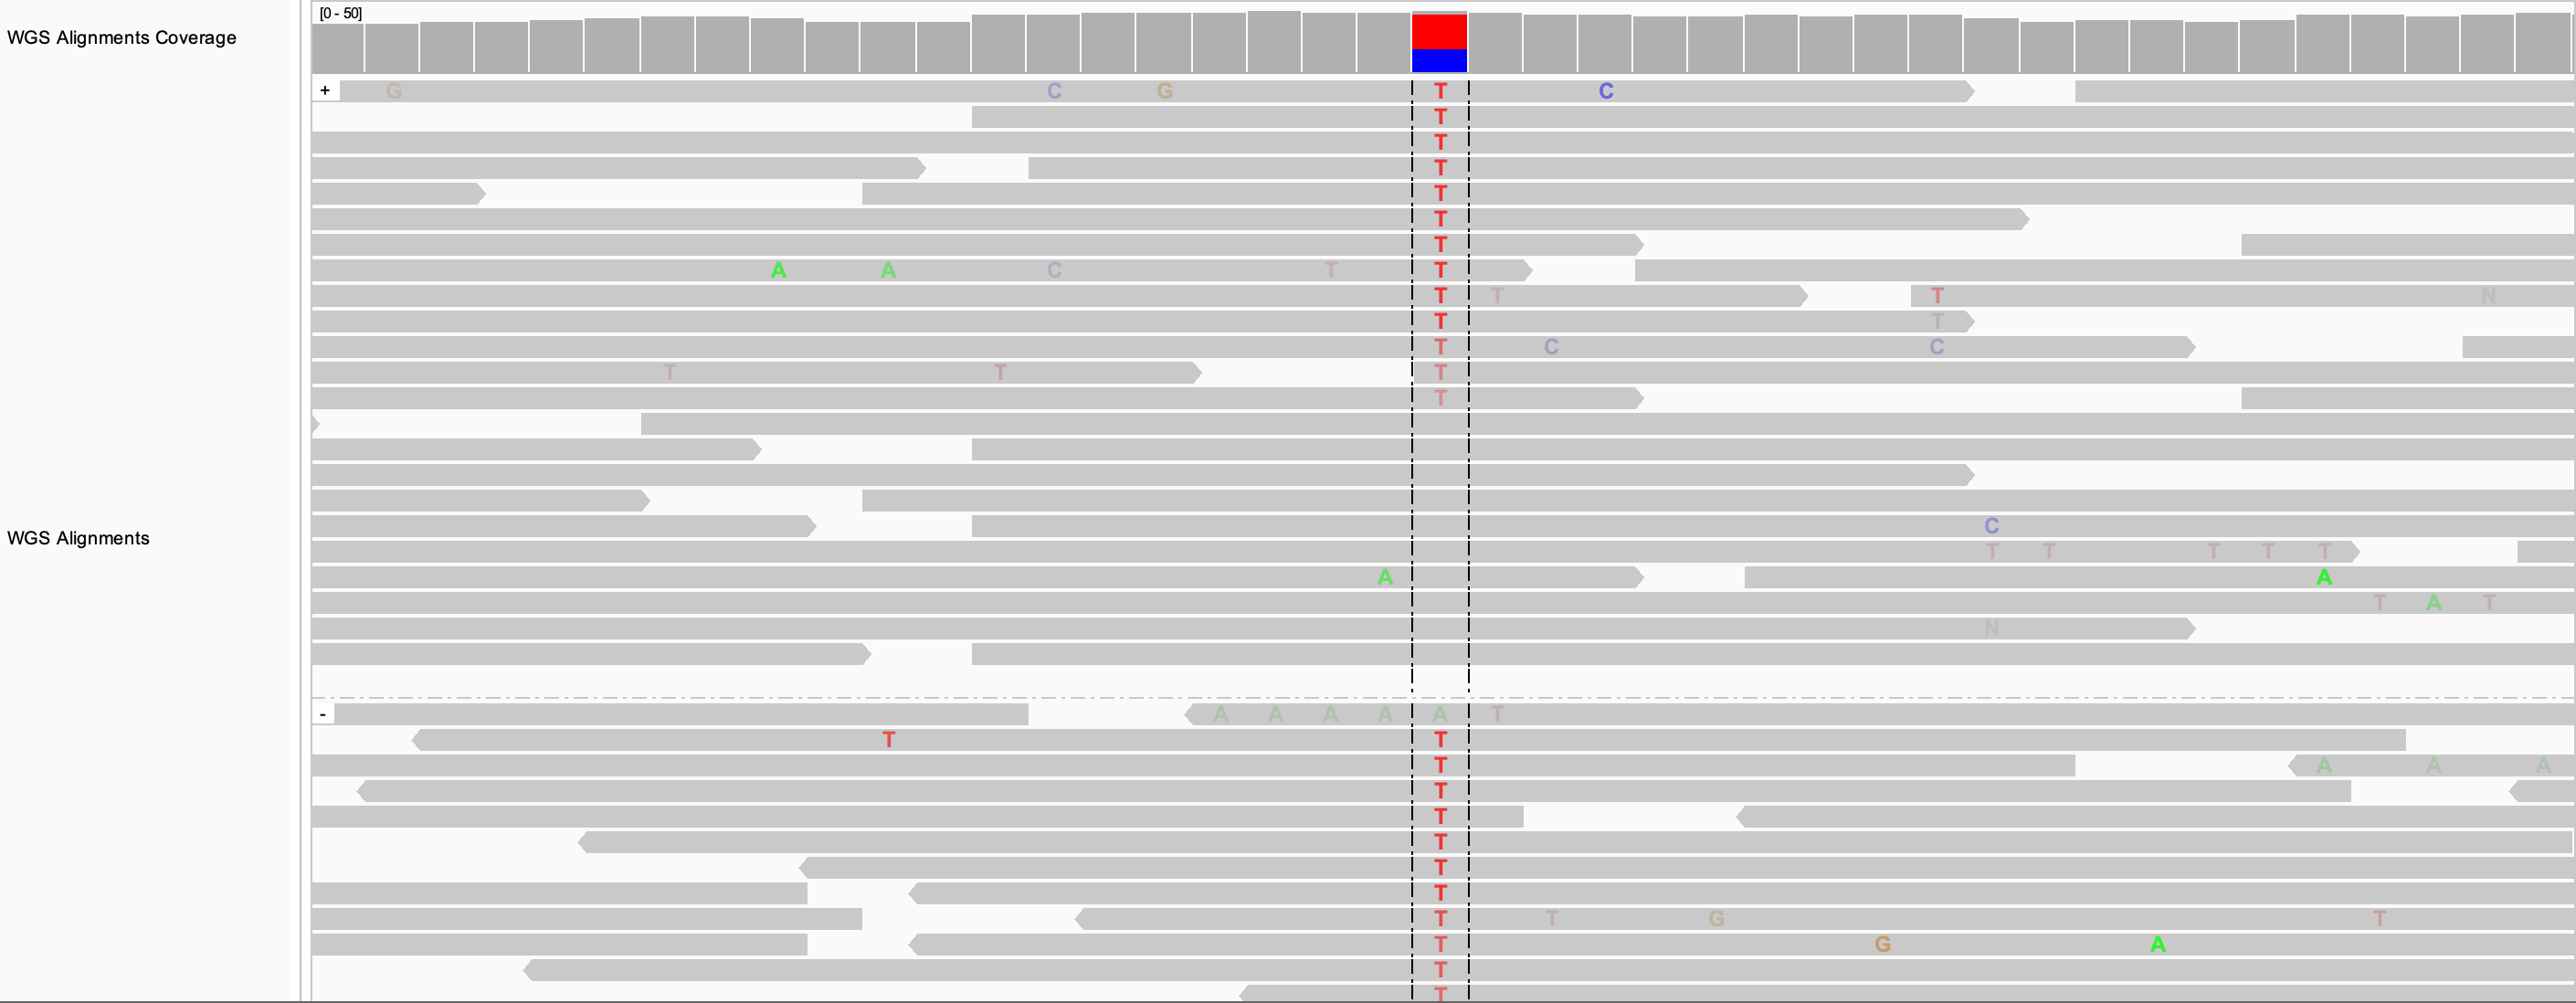
In the following example, the alignments are both colored and grouped by read strand.
To reverse the display of the groups, click on Group alignments by and select Reverse group order. In the above example that would have the effect of moving the group of purple (negative strand) alignments to the top, and the group of pink (positive strand) alignments to the bottom.
To undo a grouping command, click on Group alignments by and select none.
A shortcut for applying the same grouping to all alignment tracks is provided via the Group all tracks option in the Group alignments by sub-menu. Selecting Group all tracks will affect all subsequent grouping commands, not any current groupings.
Sorting#
To sort the alignments in a track, click on Sort alignments by in the track's pop-up menu and select one of the options in the sub-menu. Options include attributes such as start location, read strand, base, mapping quality. Not all options are applicable to all alignment tracks. For example, some options are specific to paired-end alignments.
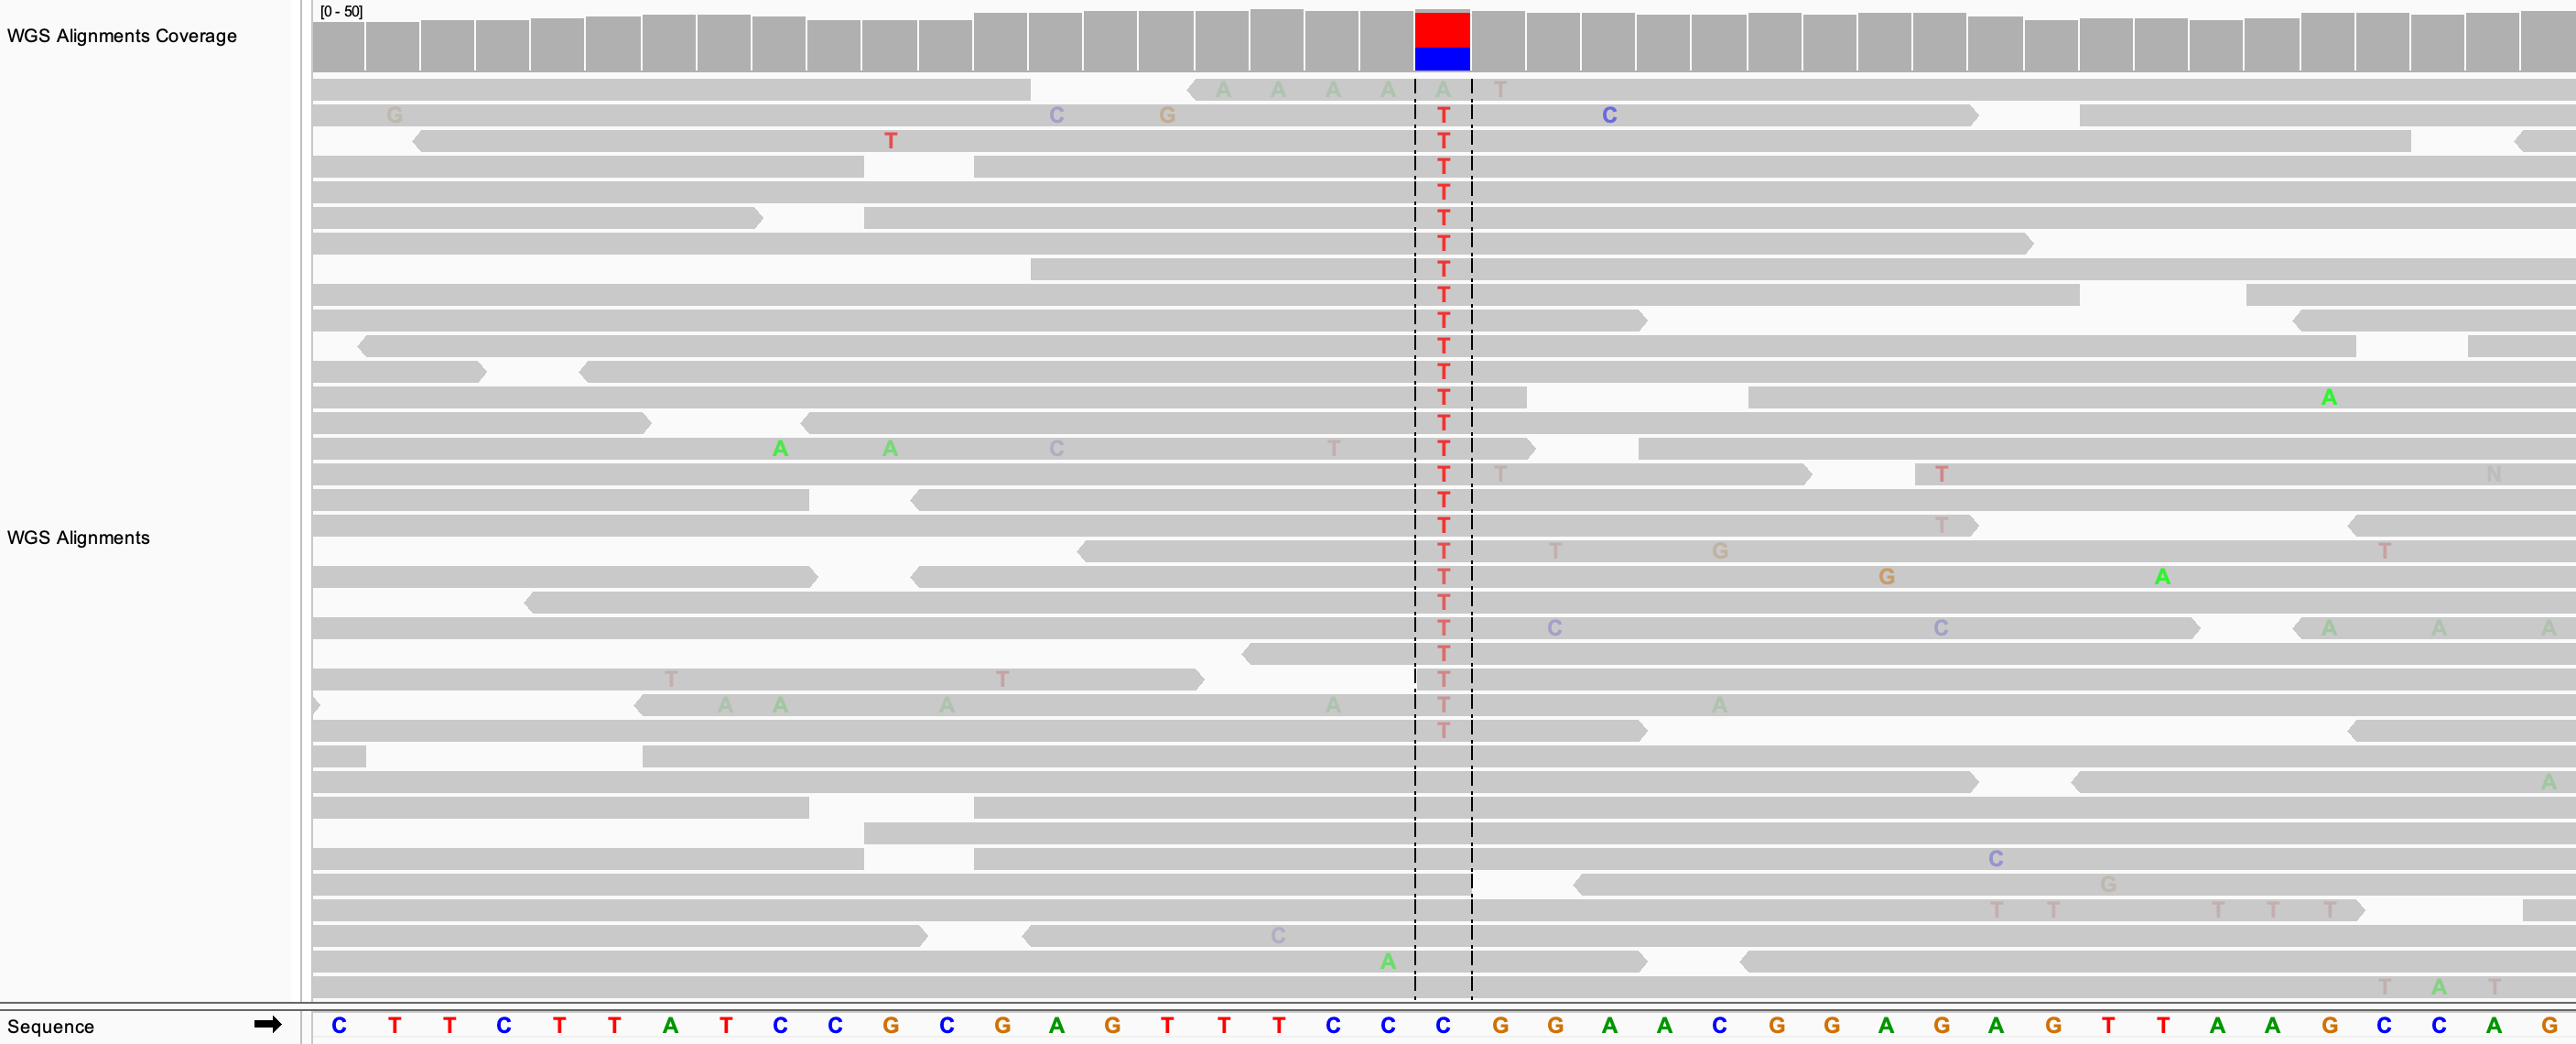
The sort is performed based on the values of the selected attribute of the alignments that intersect the locus at the center of the view, no matter where the cursor was located for the right-click. To display a line down the center of the track, set the_Show center line_property in View > Preferences > Alignments.
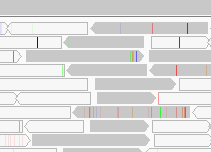
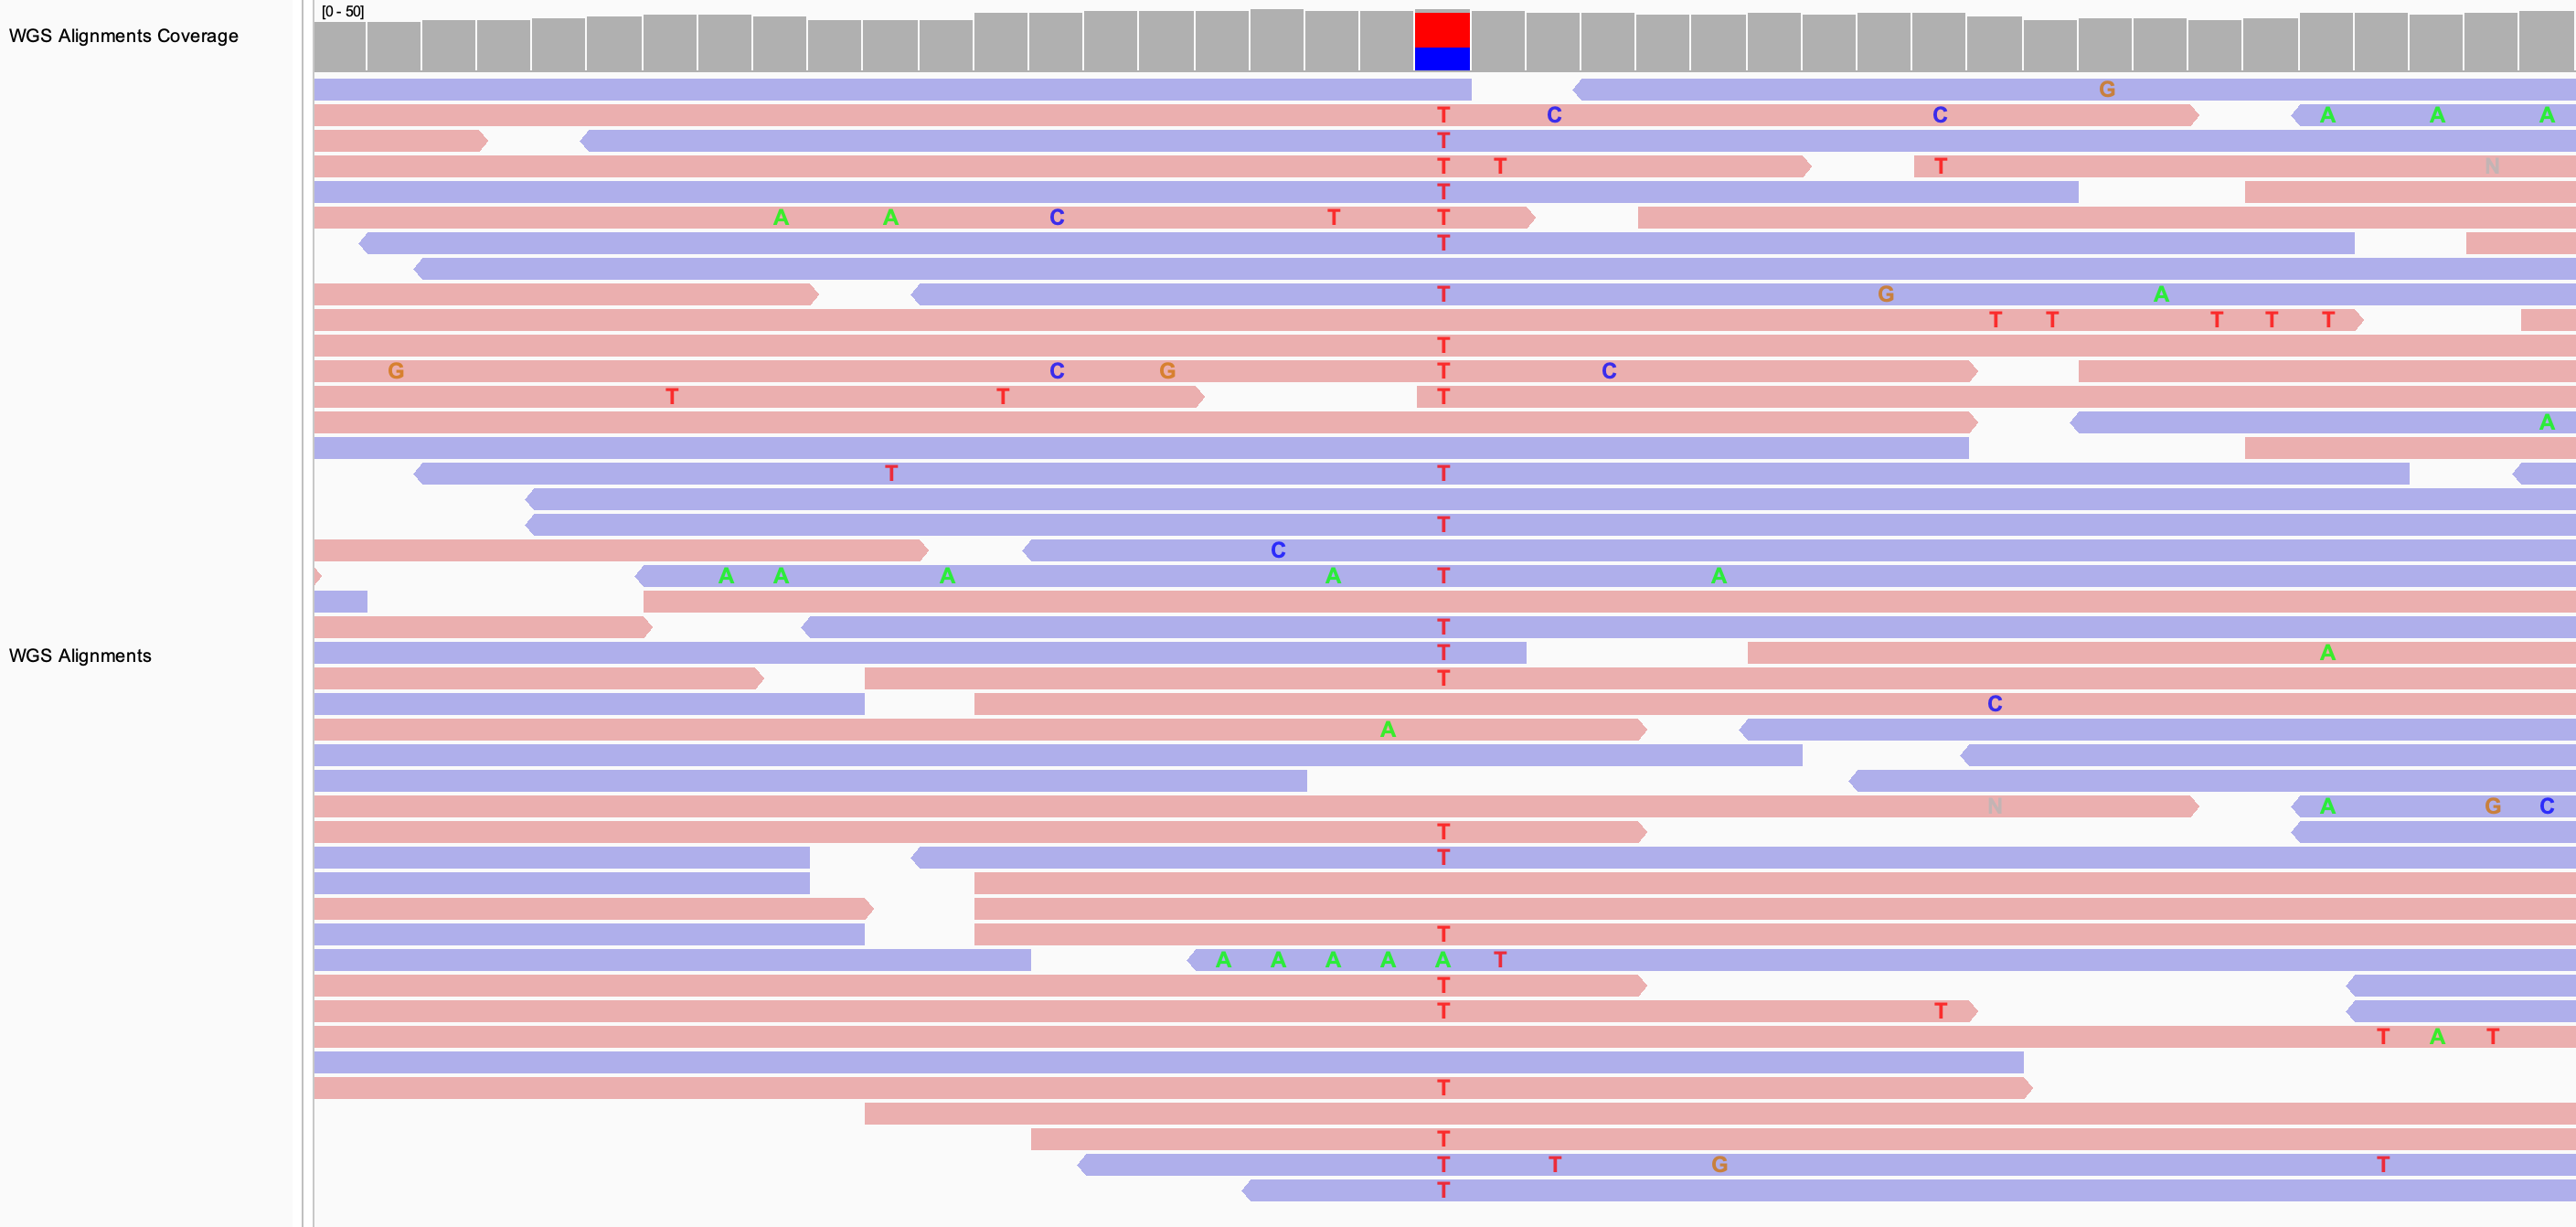
In the following example, the alignments are sorted by base. The putative SNP site was first centered in the view.
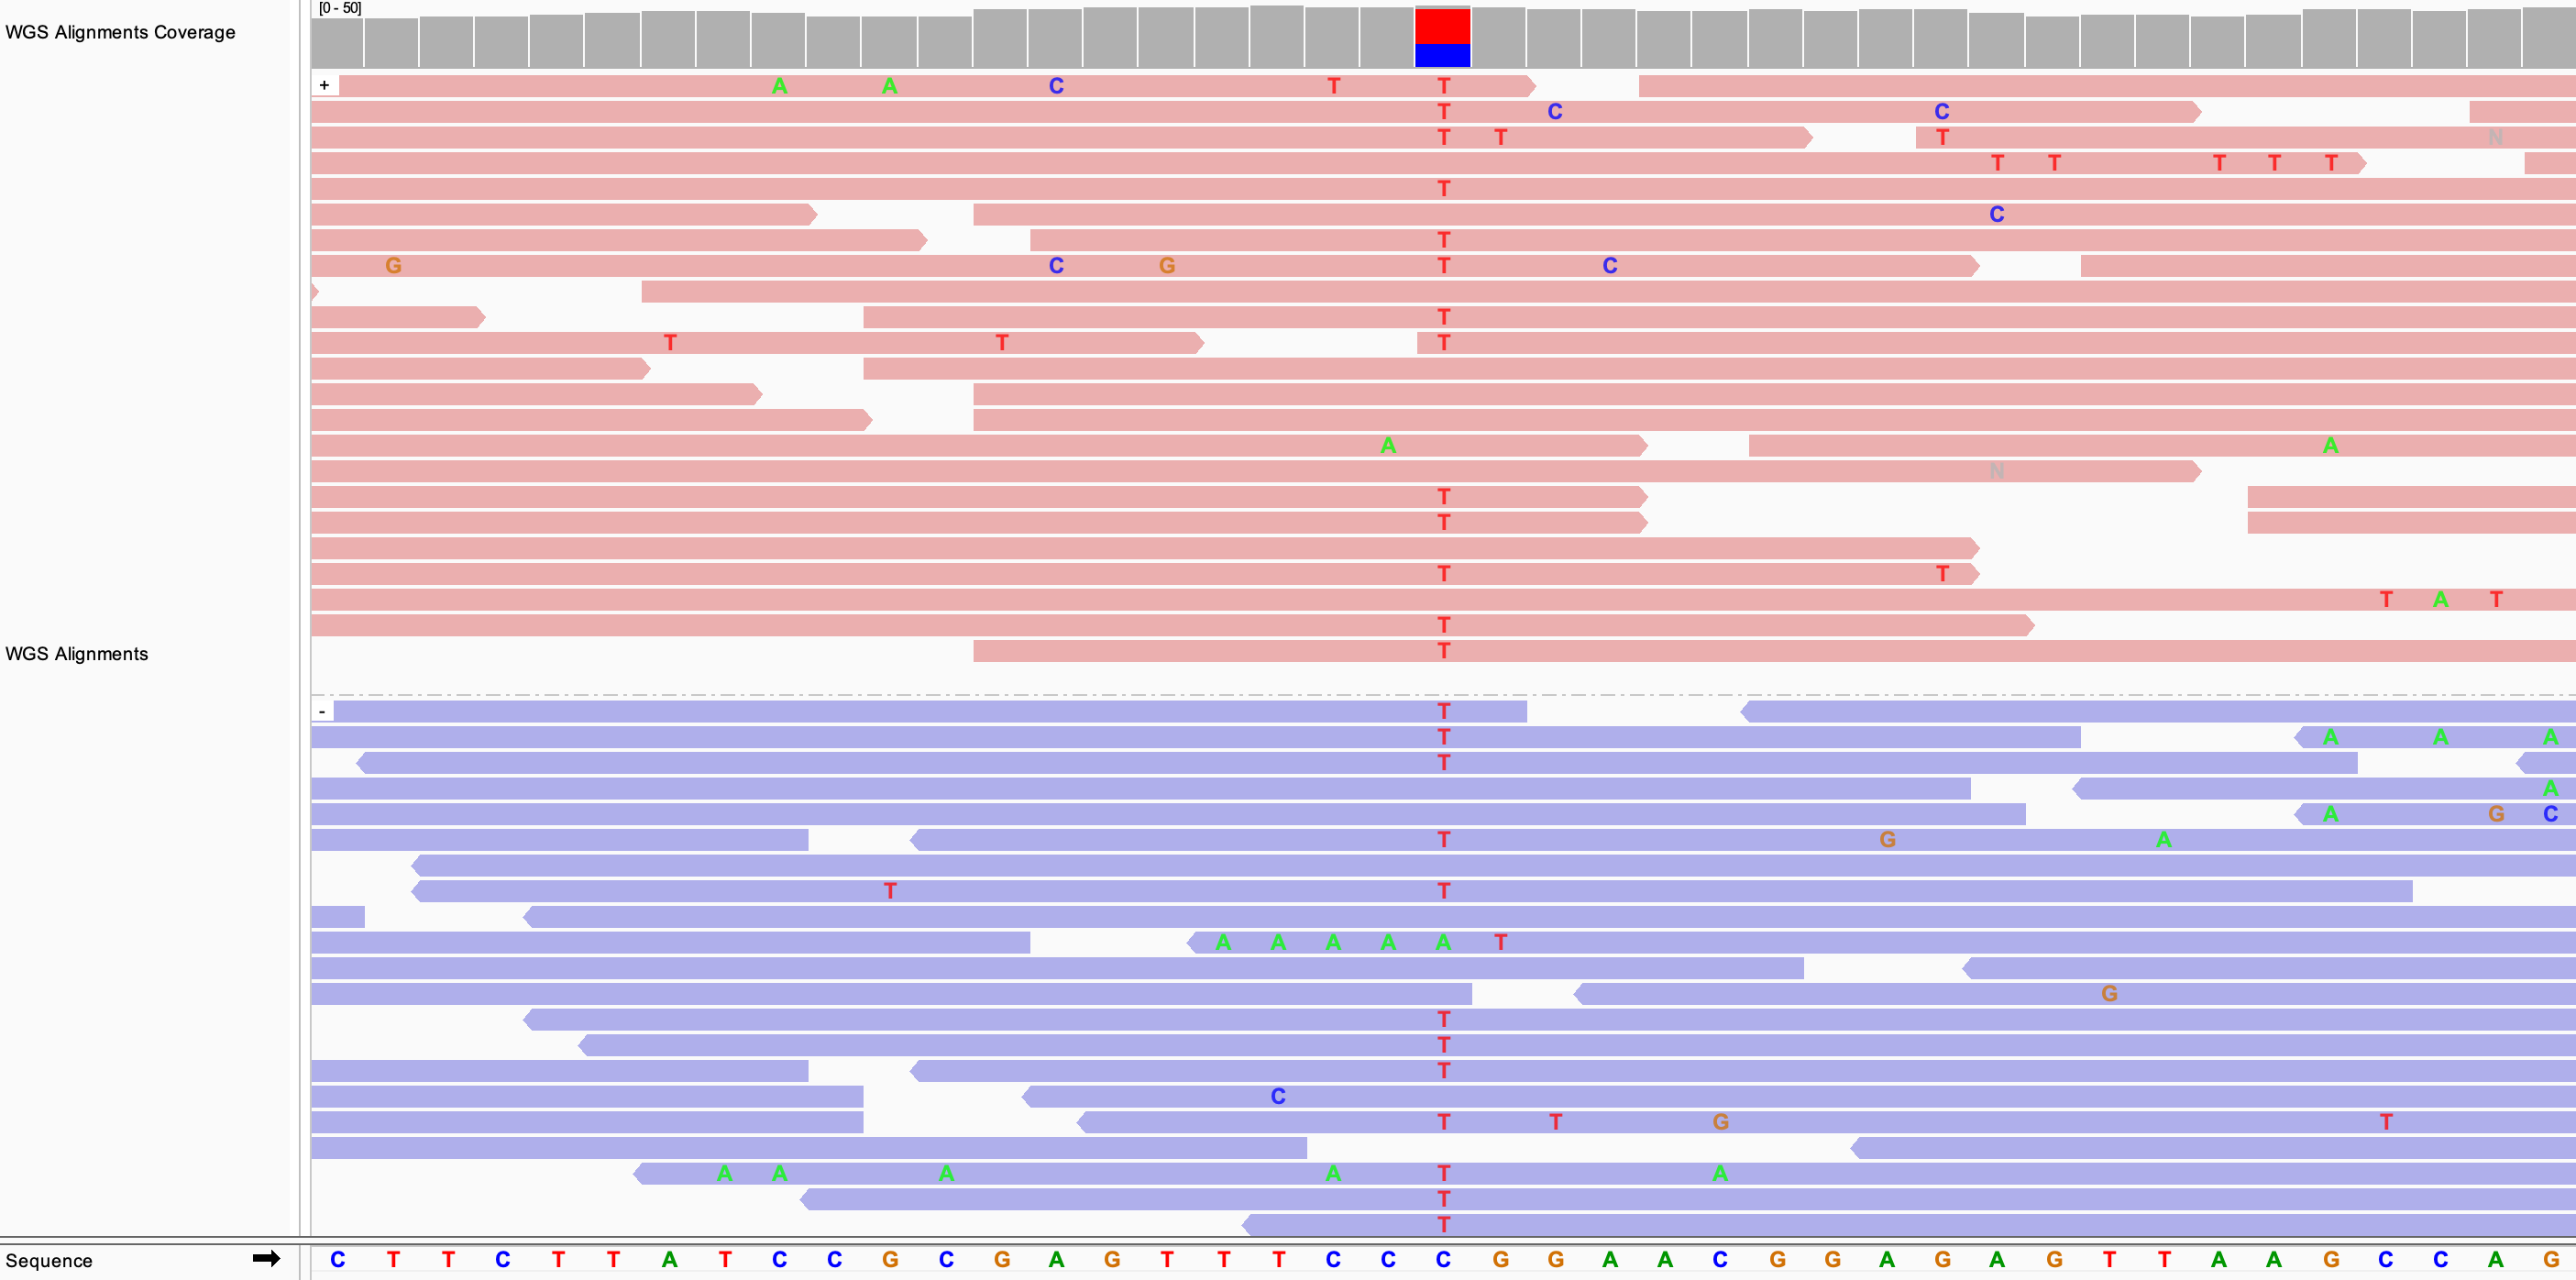
If the alignments are already grouped, the sort is applied to each group separately. In the following example, the alignments were grouped by read strand before applying the sort by base.
To reverse the sort order, click on Sort alignments by in the track's pop-up menu and select reverse sorting in the sub-menu.
The sort is an action that is applied once to the alignments at the center of the view. If you scroll the view or jump to a different locus, the sort is not performed again. Pressing Ctrl-S is a shortcut for performing the same sort again at a new locus.
To undo the sort and restore the layout to an optimally packed configuration, select Re-pack alignments from the track's pop-up menu.
Splice junction track#
The splice junction track is described in the section on RNA-seq data.
Downsampling#
In areas of deep read coverage, by default the reads are downsampled, i.e. not all the reads are displayed. This is done to reduce memory usage. The level of downsampling is controlled with the parameters:
- Sampling window size; default 50 bases
- Maximum number of reads per window; default 100
To change the defaults, set the values in the Downsampling section of the Alignments tab in the View > Preferences window. Note that 3rd gen tracks are not downsampled by default; it can be enabled in the Third Gen tab.
If your file has deep coverage and you want to be able to see more of the reads, try decreasing the visibility window before you disable or decrease the downsampling. The narrower window will help keep the memory usage down.
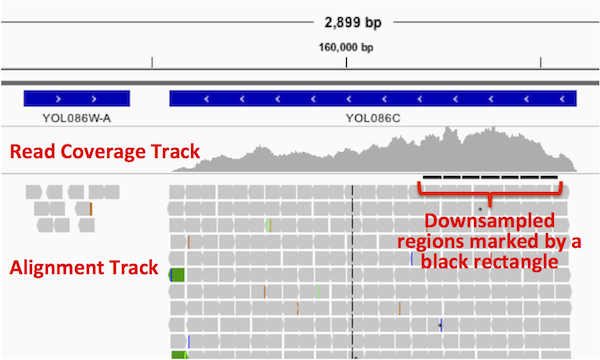
Areas where the reads have been downsampled are marked with a black rectangle just under the coverage track, as shown in the example below.
The coverage track shows the coverage for all the reads, even when only a subset of the reads are displayed.
Consensus sequence#
The menu item "Copy consensus sequence" calculates the consensus sequence for the region in view and copies the information to the clipboard. The method for calculating the consensus is taken from Cavener, Nucleic Acids Res. 15, 1353-1361, 1987.
-
If the frequency of a single nucleotide at a specific position is greater than 50% and greater than twice the number of the second most frequent nucleotide it is assigned as the consensus nucleotide.
-
If the sum of the frequencies of two nucleotides is greater than 75% (but neither meet the criteria for a single nucleotide assignment) they are assigned as co-consensus nucleotides.
-
If no single nucleotide or pair of nucleotides meets the criteria, assign an 'N'.